
Below you will find data from the inaugural Lived Experiences and Needs of Students (LENS) Survey. The LENS Survey was administered in Spring 2024 and is a joint effort between Columbia Health, CUIMC Student Health on Haven, and University Life (LENS Survey Working Group).
We designed the LENS Survey to give us a deeper understanding of student experiences and needs across several areas including basic needs, physical and mental health, well-being, and sexual respect. We are sharing the findings from this survey to inform collective efforts to improve the student experience in classrooms, residence halls, student organizations, departments, services, and schools across the University.
Methodology
The LENS Survey Working Group created the instrument using questions and scales from a range of existing surveys, including validated scales where available.[i] Throughout the process, we solicited input from campus stakeholders, including Columbia University students, faculty, and staff.
Columbia University Irving Medical Center's Institutional Review Board (IRB) approved the survey and its procedures (AAAU-8610).
Qualtrics/Isobar, an external survey provider, administered the survey online from February 9 to March 25 of 2024. Using a census approach, all eligible Columbia students (N=35,894) received survey invitations by email from University leadership, with subsequent reminder emails from Qualtrics/Isobar. Students eligible for participating in the survey were:
- 18 years or older as of February 9, 2024
- Enrolled for the Spring 2024 semester as of February 9, 2024
- Enrolled at one of Columbia’s 17 schools or three affiliate institutions (Jewish Theological Seminary, Teachers College, and Union Theological Seminary)[ii]
The survey took approximately 20 to 30 minutes to complete. Students completed the survey anonymously (without names or identifying information) and Columbia did not receive any identifying information about individual participants. Students had the option to not respond to any question, with the exception of school affiliation. After completing the survey, respondents received a $10 gift card via Qualtrics/Isobar. Care was taken to ensure that claiming of incentives did not compromise respondents’ confidentiality.
To preserve the confidentiality of the respondents, we have included data only when a sufficient response count was collected (>10 responses) for a given variable, particularly when broken down by gender identity.
The overall response rate is comparable to similar student surveys from universities across the country.[iii] Among the 17 schools and three affiliates, response rates ranged between 14% and 49%.
While we collected a wide array of information about the lived experiences of students enrolled at Columbia University during Spring 2024, the LENS Survey has inherent limitations. Please keep these in mind as you consider the results presented in this report:
- Data is self-reported and has not been weighted to account for demographic differences.
- The report primarily represents frequencies; therefore, apparent differences between groups should not necessarily be interpreted as statistically significant differences.
- This report shares preliminary descriptive data analysis and does not assert any causal explanation of findings.
Further, the survey data and analysis should be considered in the context of campus protest activities in the fall and spring semesters of the 2023-2024 academic year. It is possible that some students may have been feeling the impact of this at the time of survey administration.
Life at Columbia
Student-Faculty Dynamics
Faculty play an important role in the lives of students:
- 58% of respondents indicated that at least one faculty member at Columbia has taken a personal interest in their success.
- 81% of respondents reported having established a strong enough relationship with at least one faculty member to request a letter of recommendation.
While only 10% of respondents reported experiencing faculty challenges, 93% of these respondents indicated that these challenges had a negative impact on their academics, non-academics, or both.
Experiences & Impact
The survey asked respondents to identify specific experiences and challenges they faced over the past 12 months. Respondents who indicated they had experienced challenges were asked about any subsequent negative impact.
Top 3 Experiences & Their Negative Impact
*% Negative Impact combines impacts related to academics, non-academics, or both.
Opportunities for the Future
As an institution, Columbia may wish to:
- Identify opportunities that support student well-being and academic success by engaging faculty with the data.
- Explore enhanced career services and ensure access for all students.
Basic Needs
Financial Security
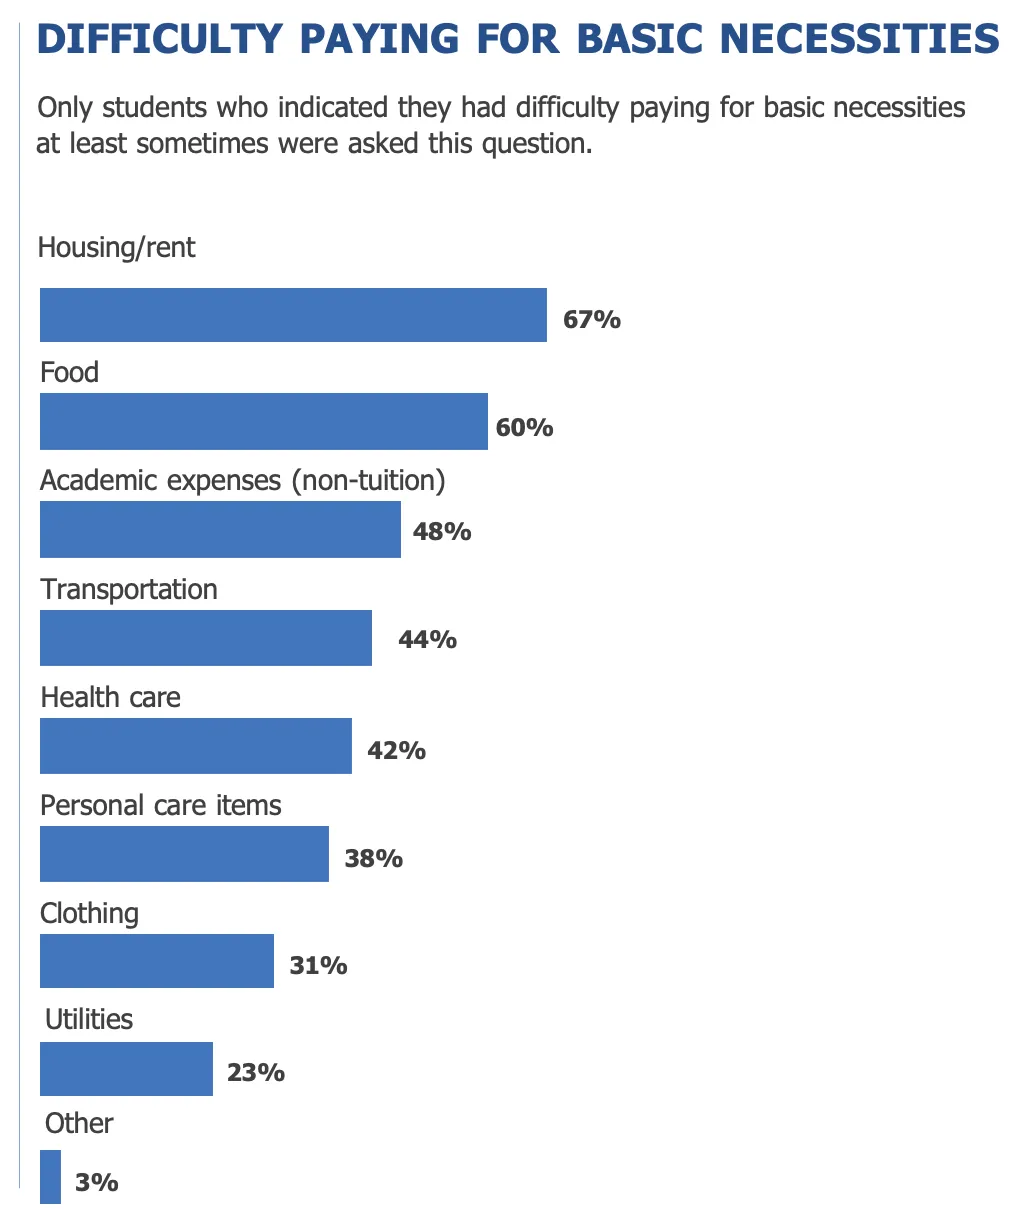
When asked how often they have experienced problems paying for basic necessities, 41% of respondents indicated that they experienced difficulties at least sometimes. This includes 15% of respondents who reported difficulty paying for basic necessities often or all of the time.
Food Security
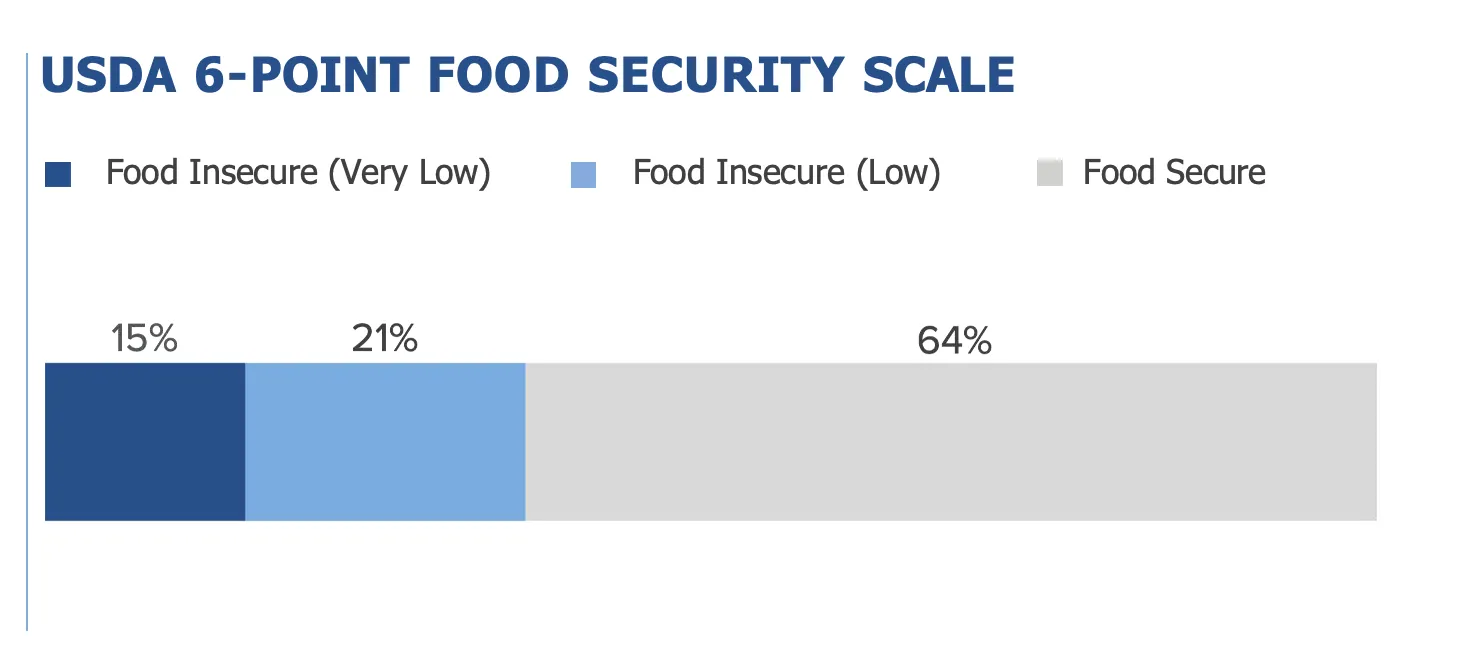
Respondents were asked about their food security in the last 30 days using the USDA 6-point Food Security Scale.[iv] Within this classification, high or marginal food security indicates few or no food-access problems or limitations. Low food security is characterized by a lack of variety or quality of food. Very low food security indicates skipping meals or not getting enough to eat.[v]
- 36% of respondents scored in the range classified as food insecure (low or very low food security)
Opportunities for the Future
- Evaluate how best to support students’ needs through direct resources and strategic referrals.
Physical Health
Respondents were asked about a variety of physical health conditions in the last 12 months. Those who endorsed experiencing a specific condition were then asked to report if this experience resulted in a subsequent negative impact.
Top 3 Physical Health Experiences & Their Negative Impact
*% Negative Impact combines impacts related to academics, non-academics, or both.
Opportunities for the Future
As an institution, Columbia may wish to:
- Engage with faculty to support students with short- and long-term medical needs that may impact their ability to attend or participate in classes.
- Identify additional opportunities for primary and secondary prevention to reduce illness and support student success.
Sleep
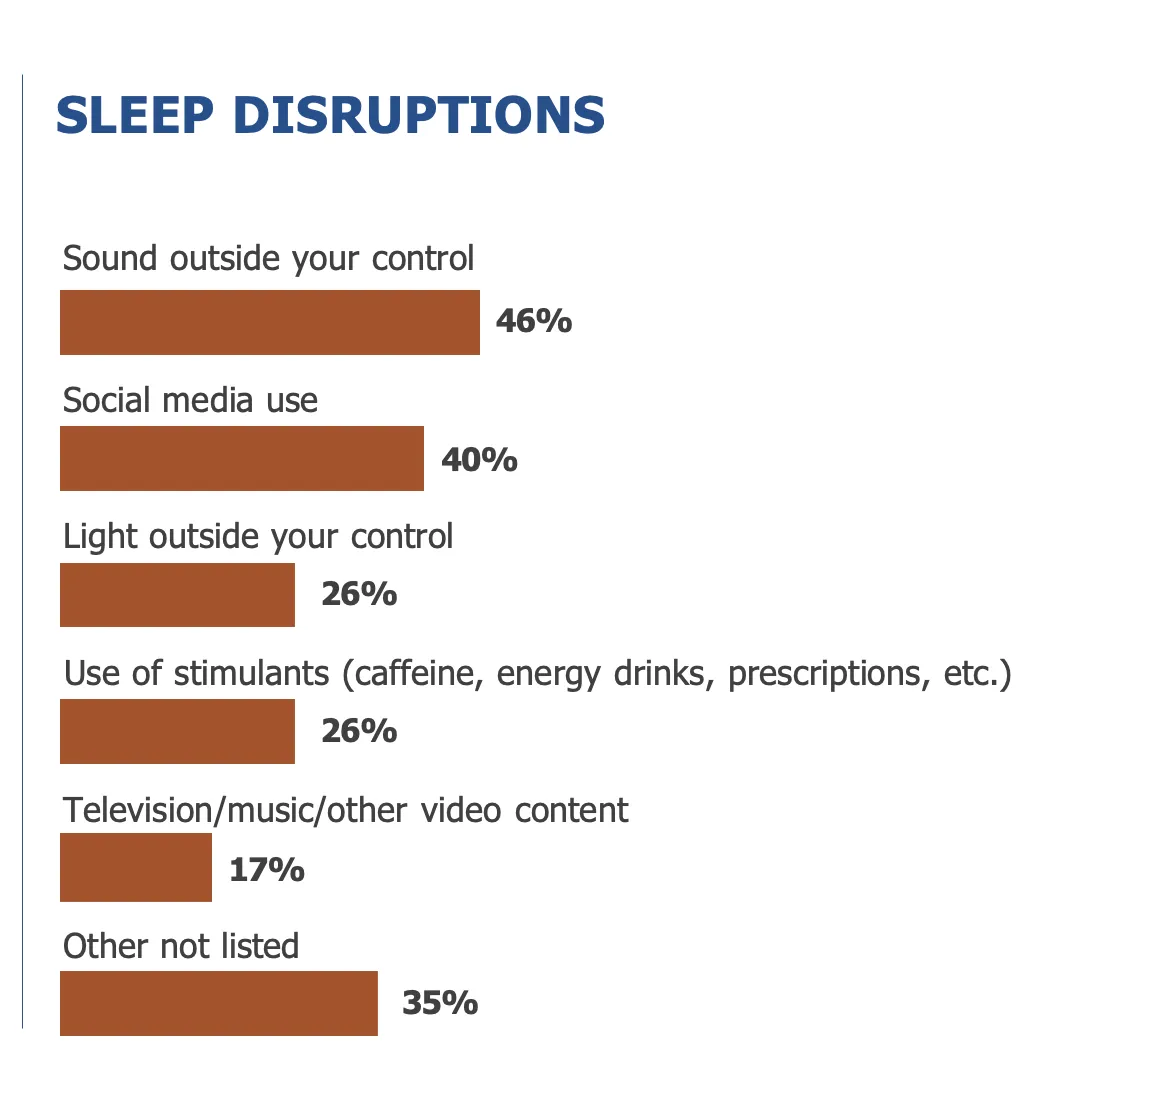
When asked about a typical month during the academic year, respondents reported getting enough sleep to feel rested only 17 out of 30 days.
The substances most frequently used to remain awake during the day or night were caffeinated beverages such as coffee, tea, or soda (reported by 63% of respondents). Five percent (5%) of respondents reported ever using a stimulant not prescribed to them to stay awake.
Opportunities for the Future
As an institution, Columbia may wish to:
- Explore how campus priorities can be a barrier to sleep hygiene and assess how environmental, structural, and policy changes could positively impact sleep.
- Engage with students to determine how their individual behaviors impact their sleep and how changes could improve their sleep quality.
- Explore how individual priorities can be barriers to sleep hygiene and adapt existing programs to address these barriers.
Mental Health
Respondents were asked to self-report their experiences with mental health conditions during the last 12 months, as well as the impact of those experiences. Negative impact was assessed in academics, outside of academics, or in both academic and non-academic areas.
Top 3 Mental Health Experiences & Their Negative Impact
*% Negative Impact combines impacts related to academics, non-academics, or both.
Regardless of past use of mental health services, 87% of respondents indicated that they would be open to seeking help from mental health professionals if they faced any personal problems in the future.
Opportunities for the Future
As an institution, Columbia may wish to:
- Explore environmental and policy changes that could positively impact mental health.
- Engage students to identify and overcome barriers to accessing mental health support.
- Engage with faculty to determine ways to infuse practices that positively impact student mental health into their classes.
- Explore different ways to connect students with the appropriate level of support.
- Engage students in skill-building opportunities both inside and outside of the classroom.
Substance Use
We assessed respondents’ use of alcohol, nicotine, and other substances through self-reporting use in the past 12 months. Overall, the majority of respondents reported consuming alcohol (77%) and tended to consume in no more than a moderate risk manner. Cannabis and tobacco were the only other substances reported by more than 3% of respondents in the three months prior to the survey.
- 92% of students reported 0-4 drinks on a typical day, if drinking
- 23% reported not drinking alcohol at all
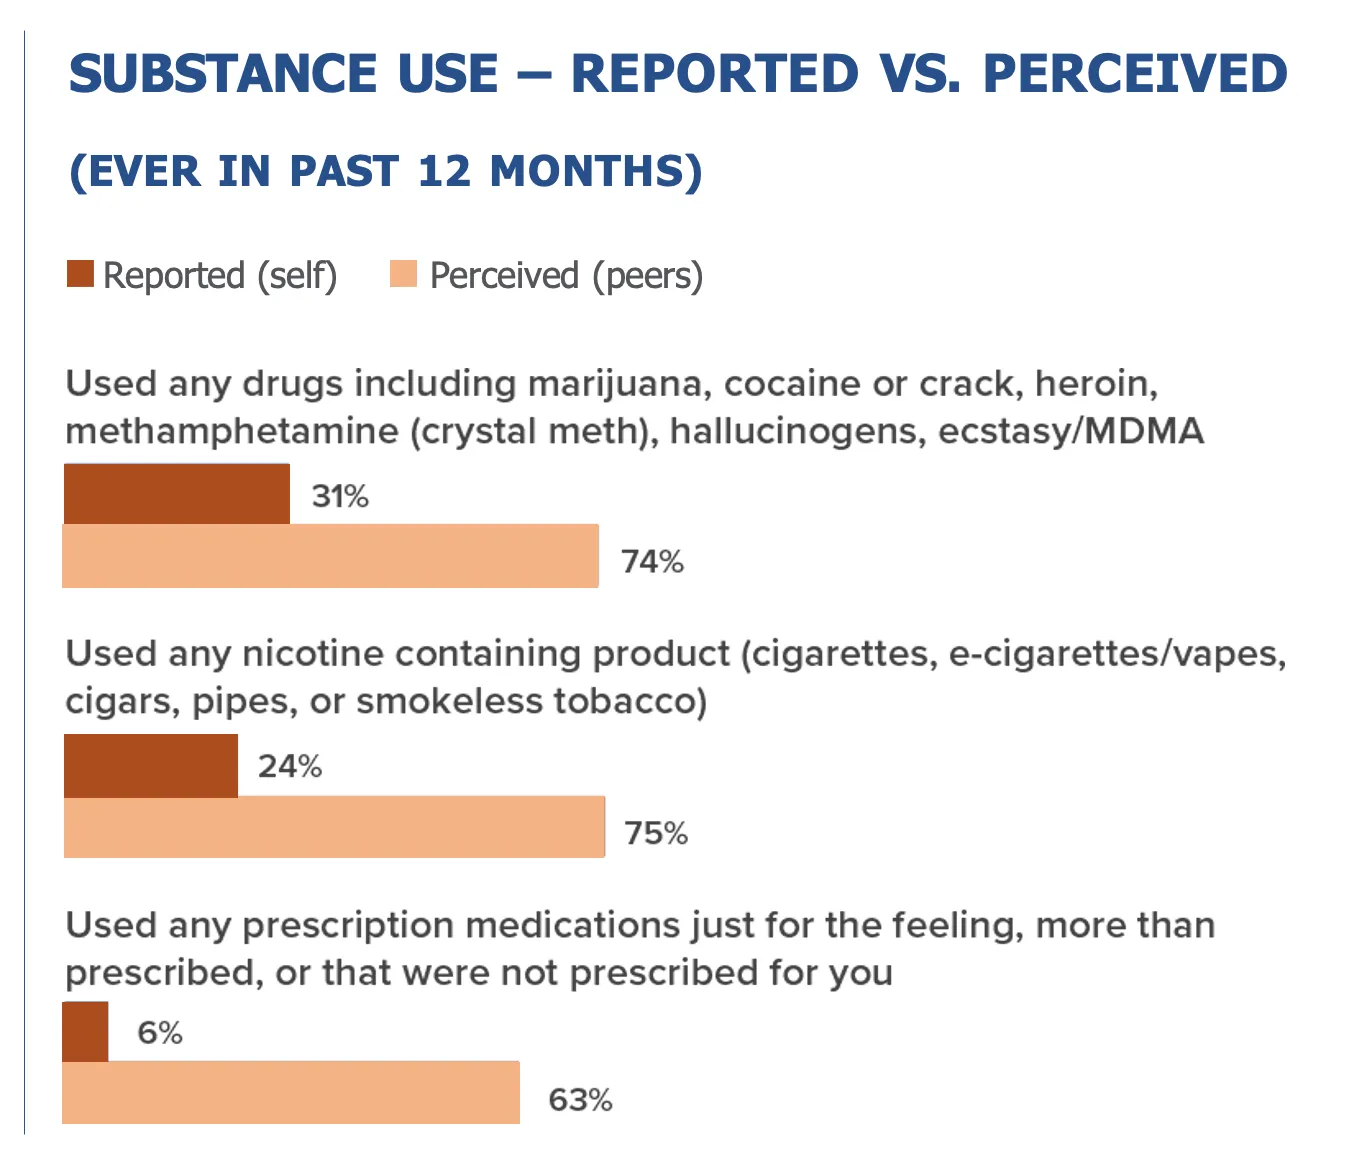
Respondents overestimate higher risk drinking
- Perception: 81% of respondents think the typical Columbia student has engaged in higher risk drinking (five or more drinks in one day)
- Actual: 8% of respondents report typically having five or more drinks in one day
Opportunities for the Future
As an institution, Columbia may wish to:
- Explore ways to focus harm reduction efforts on infrequent higher-risk drinking events.
- Explore ways to correct misperceptions about students’ substance use and misuse.
Well-Being
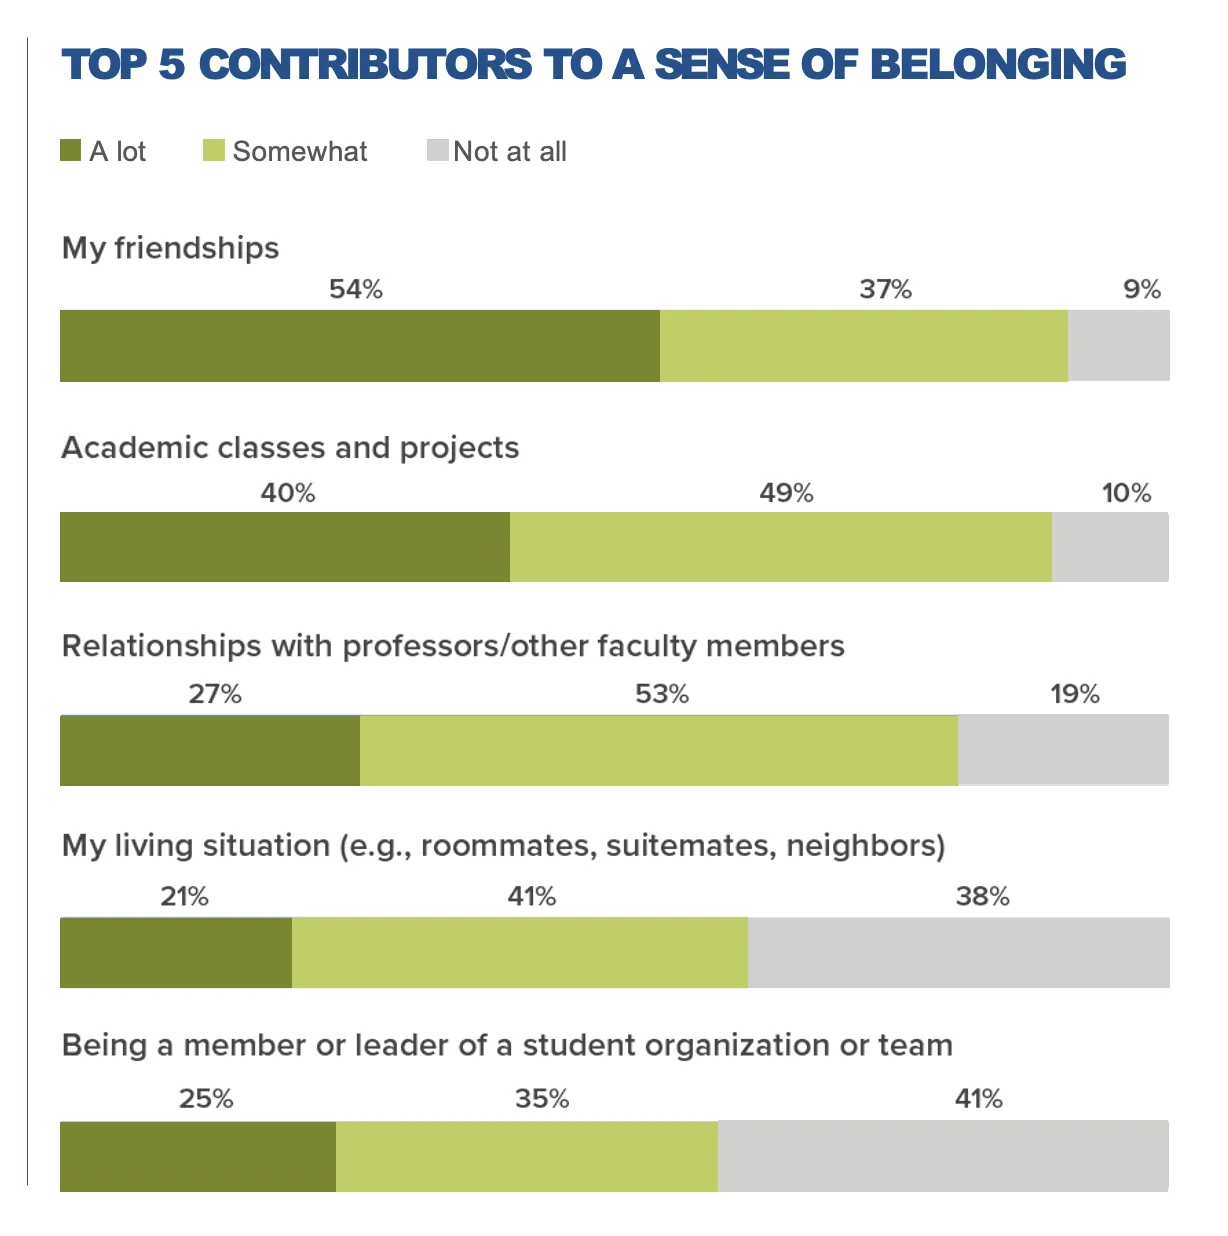
75% of respondents positively endorsed the statement “I feel I belong at Columbia.” Among this group, 32% somewhat agreed with this statement and 43% agreed or strongly agreed.
Friendships were the most frequently reported factor that contributed a lot or somewhat to respondents’ sense of belonging (91%). Over half of respondents also cited connections with staff and administrators (57%) as well as orientation experiences (53%) as influential factors.
Opportunities for the Future
As an institution, Columbia may wish to:
- Engage with students to determine the variety of ways in which they would like to build connections with other students, faculty, and staff.
- Normalize the typical stressors and setbacks found in the university setting as challenges that many students can and will overcome with sufficient support.
Gender-Based Misconduct
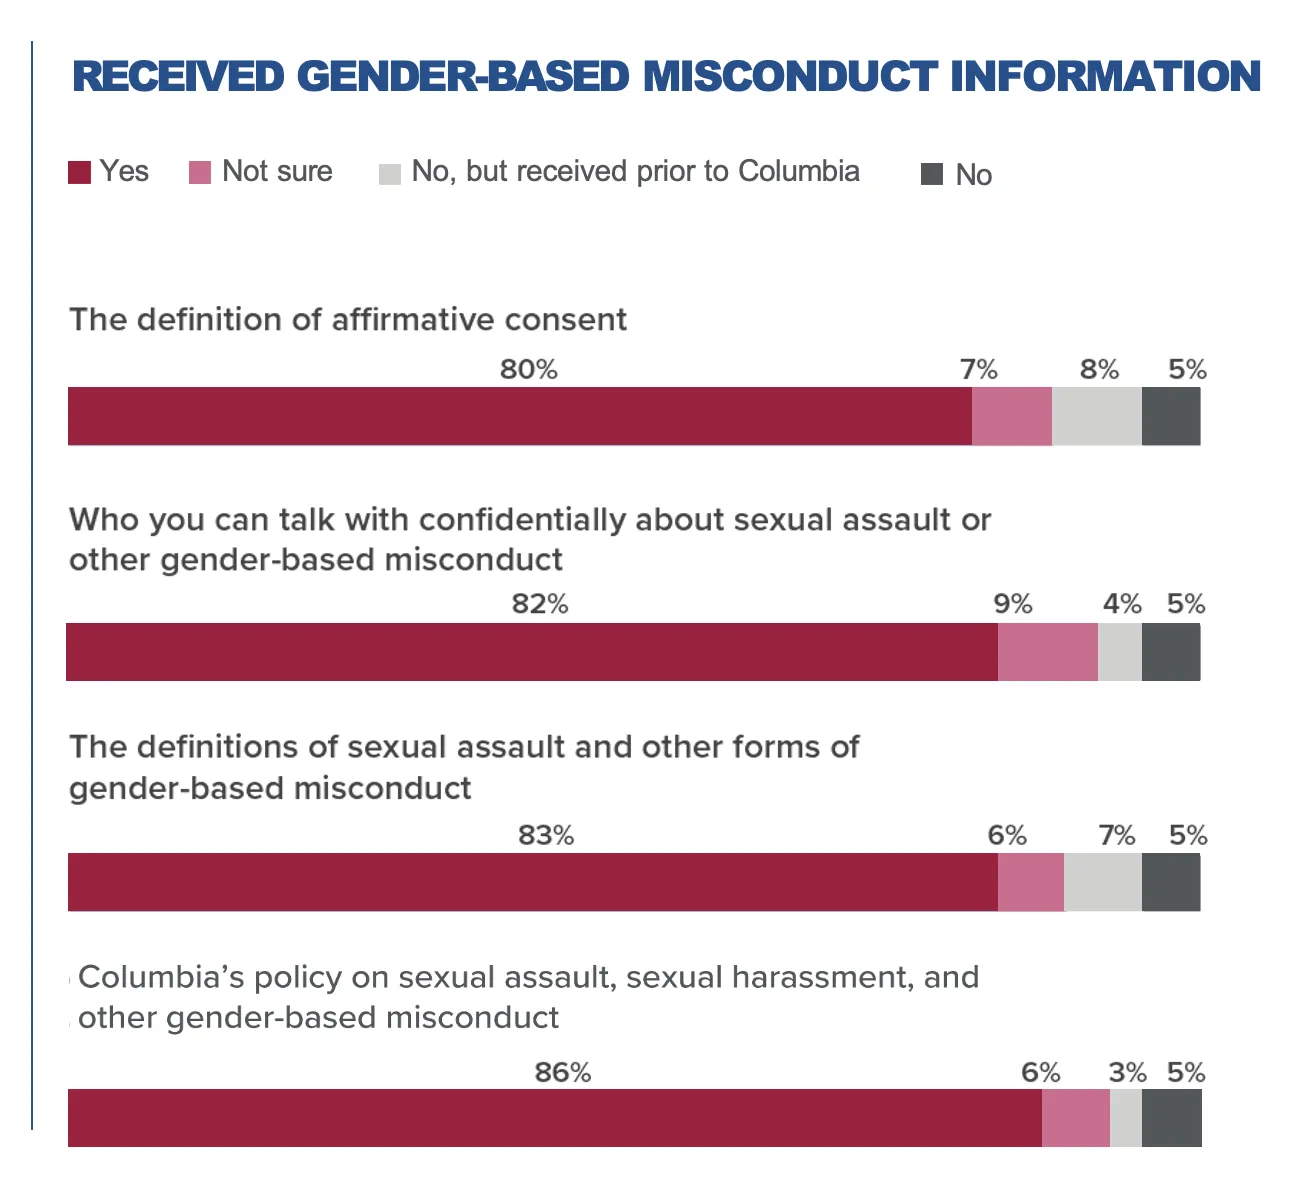
More than 80% of survey respondents reported having ever received gender-based misconduct information from someone at Columbia, including definitions of consent and gender-based misconduct, Columbia’s policy regarding gender-based misconduct, and gender-based misconduct resources offered on campus. While 5% of respondents reported not receiving this information, all Columbia students receive mandatory training on these topics.
Furthermore, respondents expressed confidence in their ability to identify where to find help and understand the procedures for reporting incidents if they or someone they know were to experience gender-based misconduct.
- 78% feel they would know where to seek assistance.
- 72% believe they would be able to report such incidents appropriately.
Opportunities for the Future
As an institution, Columbia may wish to:
- Explore ways to minimize known barriers to accessing campus resources.
Notes
[i] When scoring these scales for reporting, respondents who did not answer all scale items were excluded from analysis.
[ii] Barnard College students were not eligible for the 2024 LENS Survey because they receive many services through their institution, including healthcare.
[iii] American College Health Association. (2024). NCHA Reference Group Data Report, Spring 2024.
[iv] The USDA “Short Form” 6-item scale uses a subset of the standard 18 items to measure food insecurity in US households. Blumberg, S. J., Bialostosky, K., Hamilton, W. L., & Briefel, R. R. (1999). The effectiveness of a short form of the Household Food Security Scale. American journal of public health, 89(8), 1231-1234.
The LENS Survey used the 30-Day Reference Period and Self-Administration versions of this measure. The last two questions of the scale were modified to include response options of “No”, “Only 1 or 2 days”, “Yes, some days, but not every day”, and “Yes, almost every day,” rather than the original “No” and “Yes” response options. The first two response options were scored as 0, while the second two response options were scored as 1.
Economic Research Service, United States Department of Agriculture. (2024). U.S. Household Food Security Survey Module: Six-Item Short Form. Retrieved from https://www.ers.usda.gov/sites/default/files/_laserfiche/DataFiles/50764/short2024.pdf
[v] The short form version of the scale combines ”high” and ”marginal” categories. It also provides an alternative interpretation of these two categories as ”food secure,” with ”low” and ”very low” food security interpreted as ”food insecure.
Economic Research Service, United States Department of Agriculture. (2024). U.S. Household Food Security Survey Module: Six-Item Short Form. Retrieved from https://www.ers.usda.gov/sites/default/files/_laserfiche/DataFiles/50764/short2024.pdf
This survey has been reviewed and approved by the Columbia University Institutional Review Board. Columbia University IRB Protocol AAAU8610.